


Wondering what's the latest 2016 population distribution of Malaysia in terms of gender, age and ethnic?
Check out the latest number here -
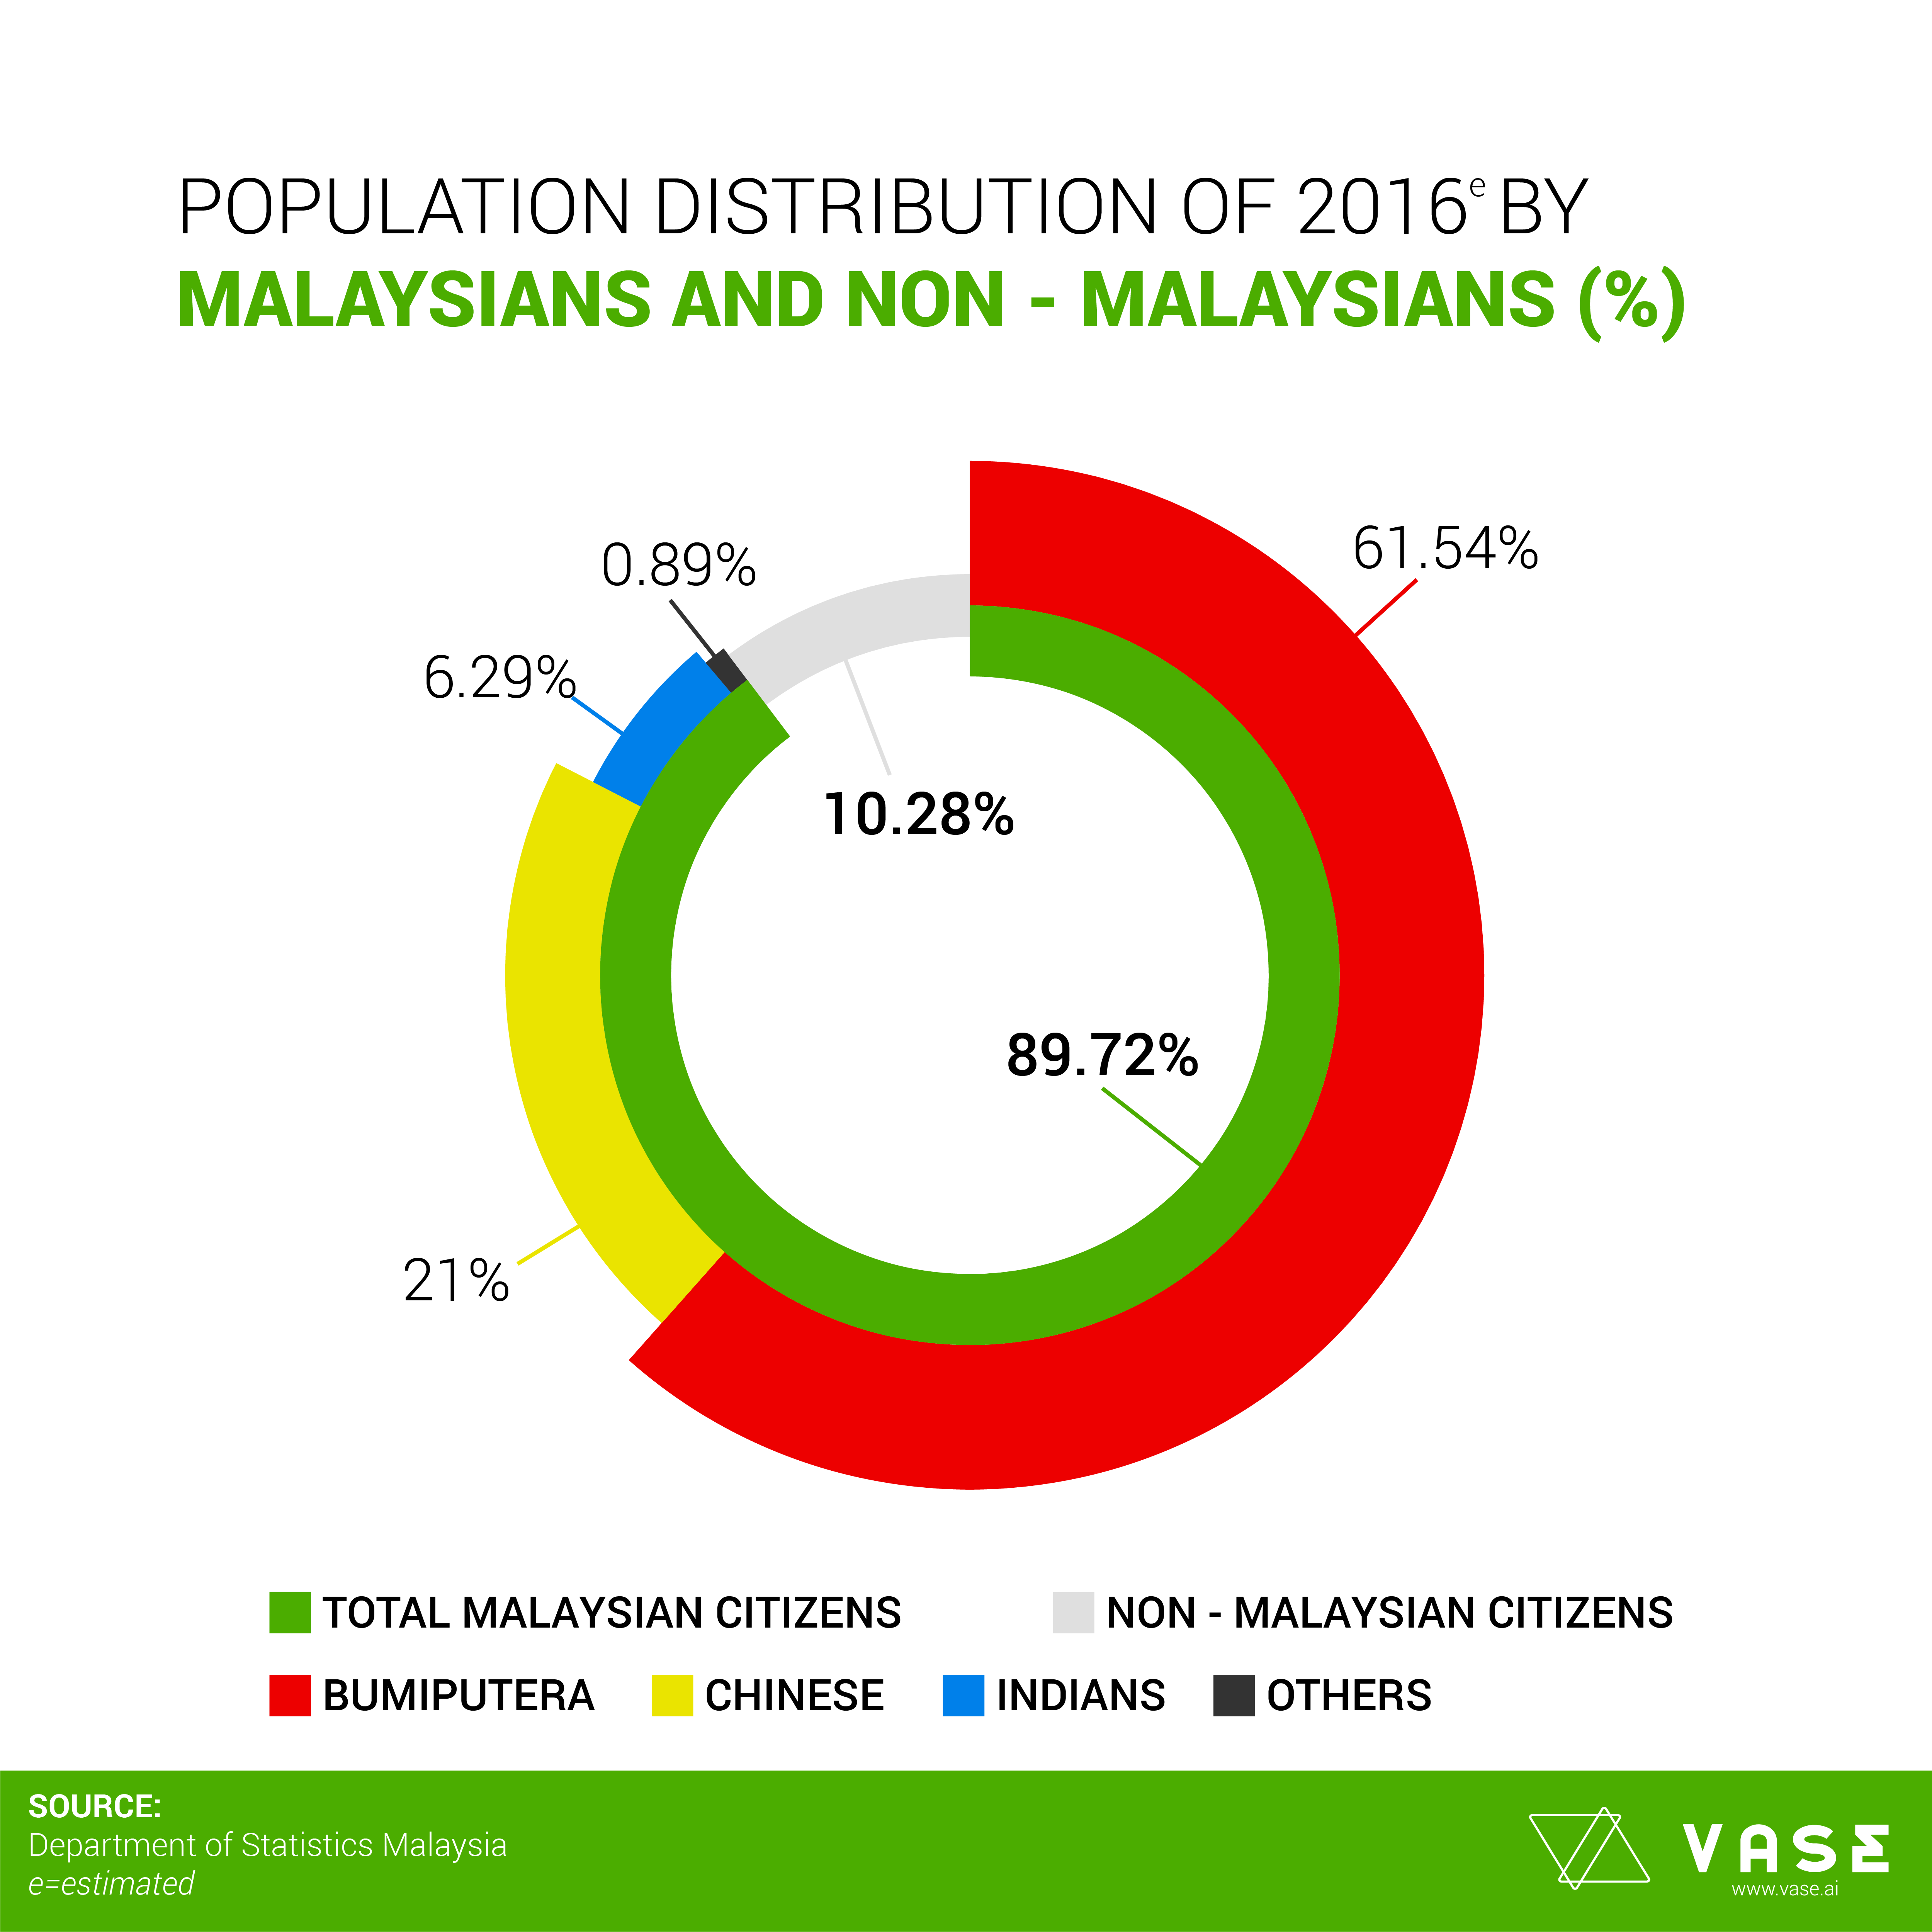
Malaysia 2016 estimated population distribution percentage shows that of the total 89.72% Malaysian citizens, the major ethnic group goes to computerate at 61.54% following it with Chinese ethnic group encompassing 21% and Indians at 6.29%. While the total population are non-Malaysian are 10.28% making it a bigger segment with than the Indians and Other smaller ethnicity combined.
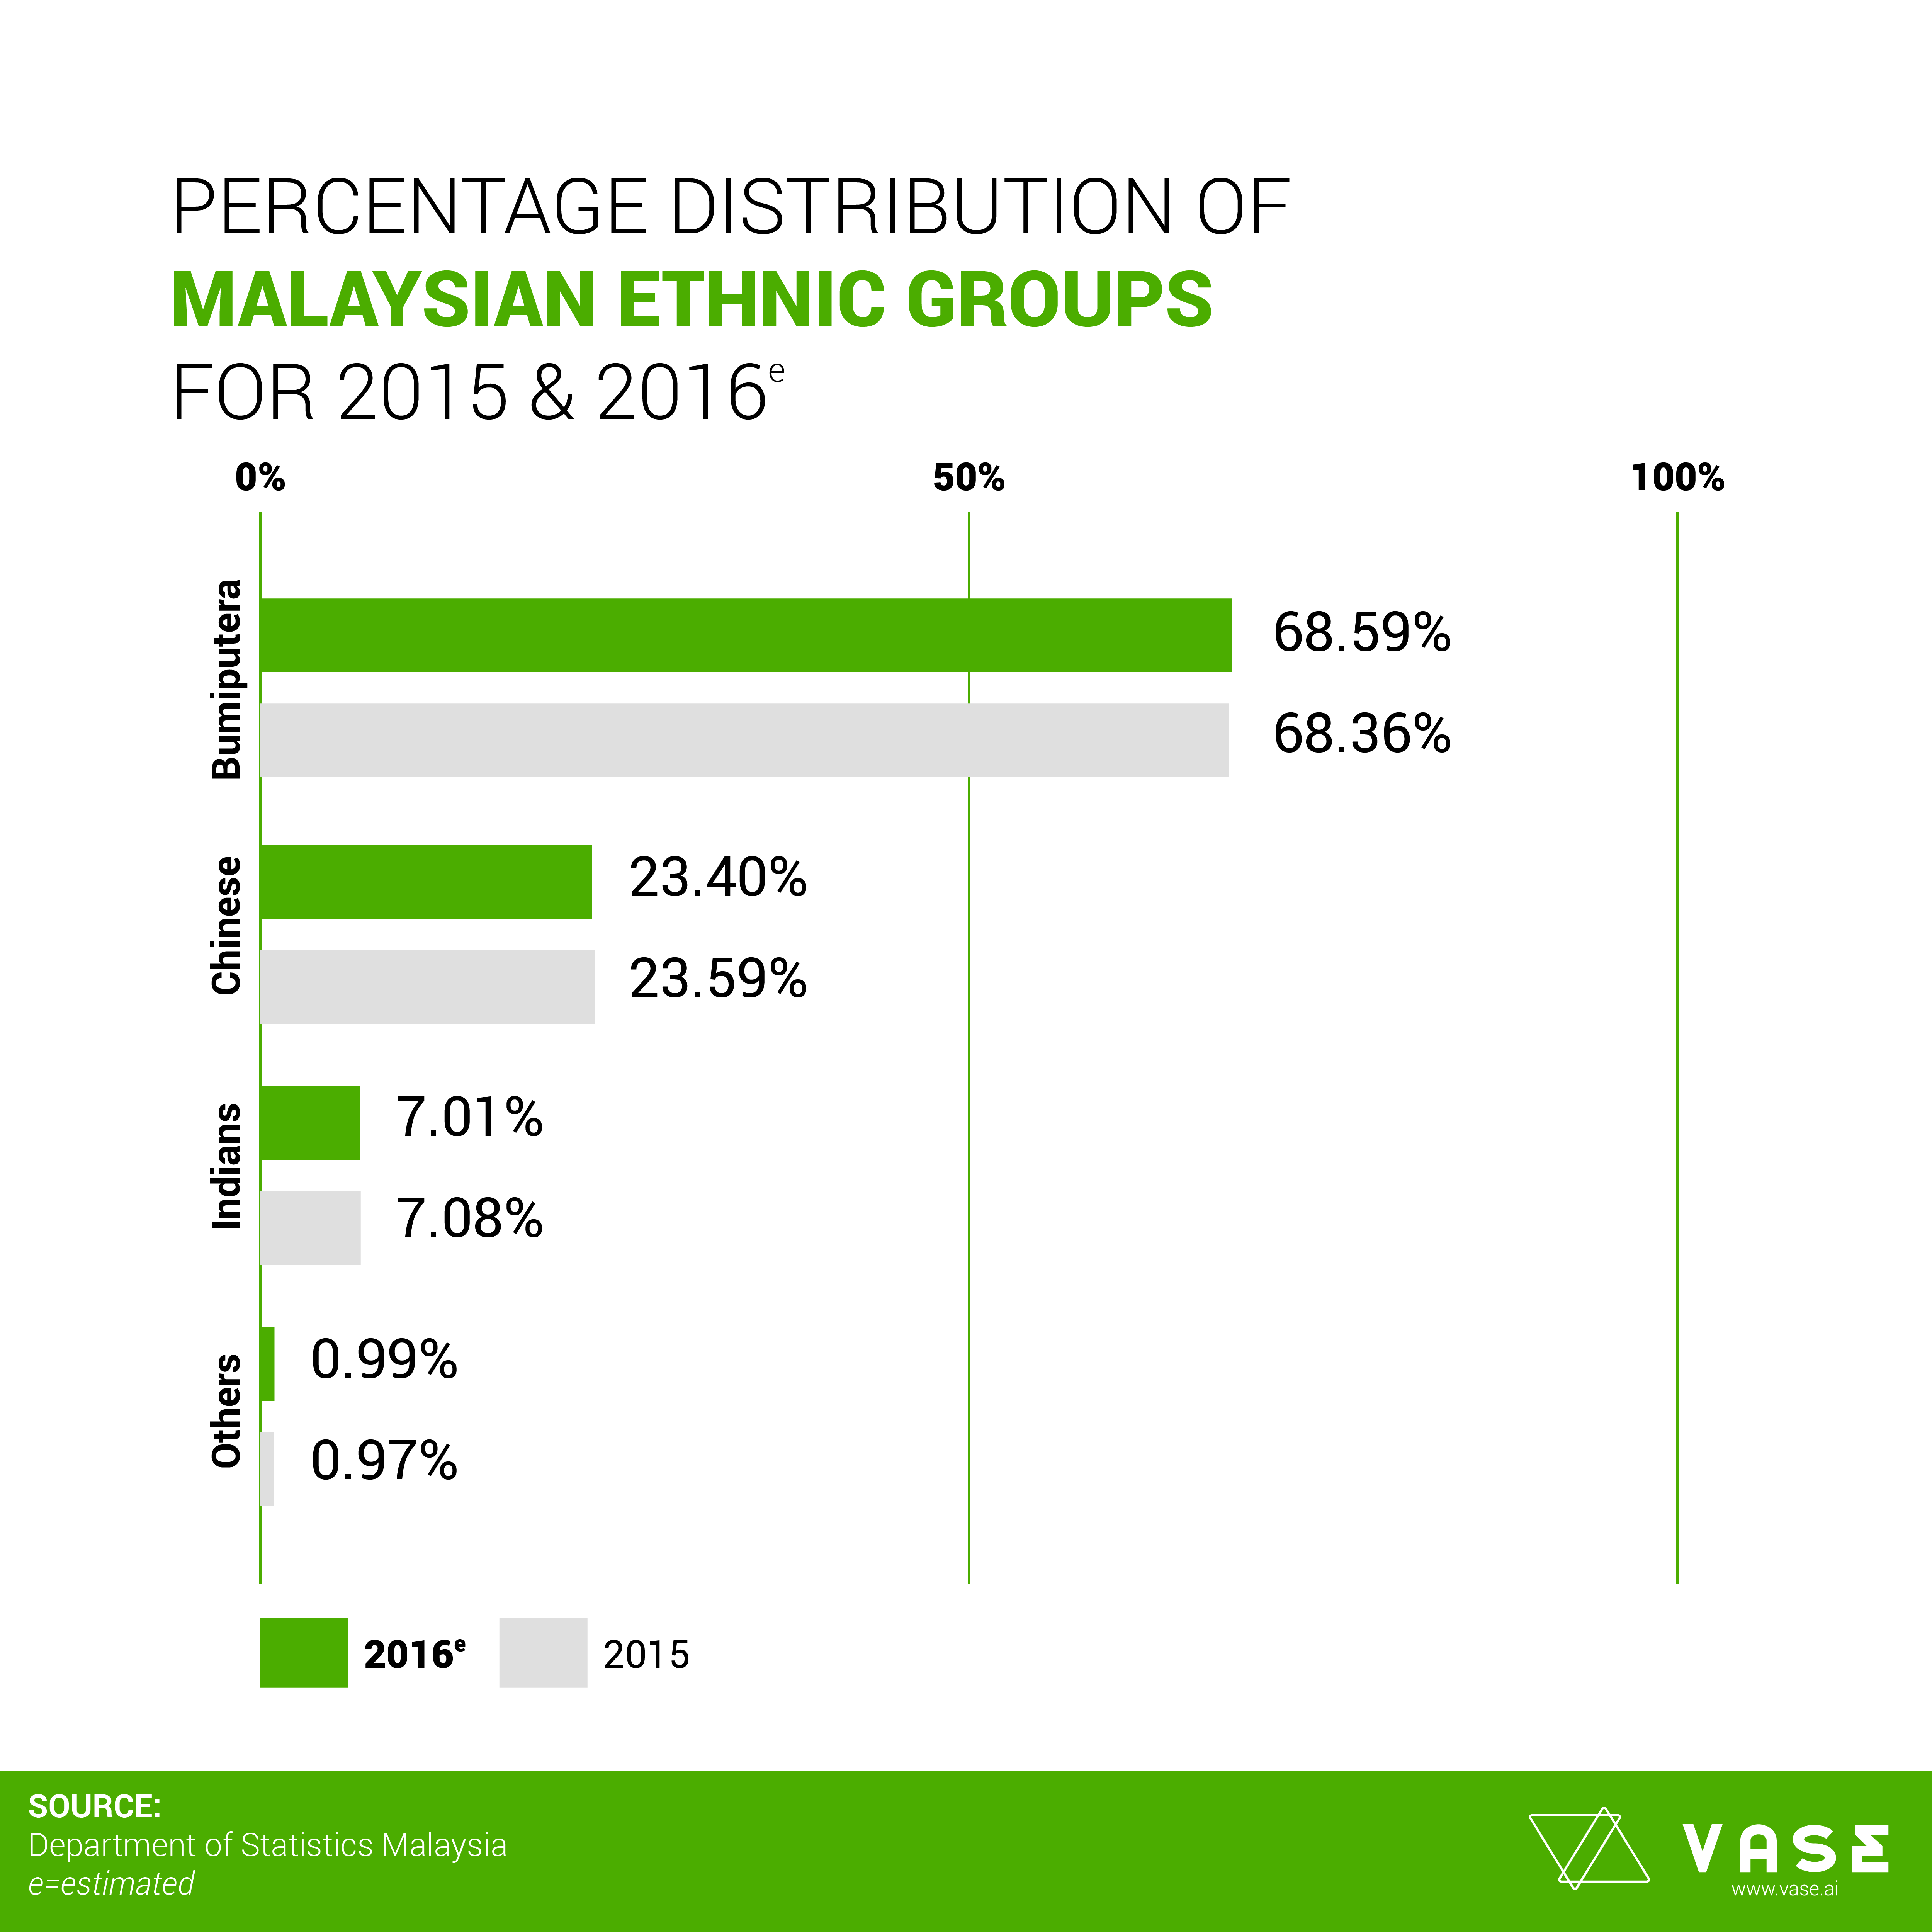
By only looking at the percentage distribution only for Malaysian citizens, there is no major difference from 2015 and the estimated 2016 data.
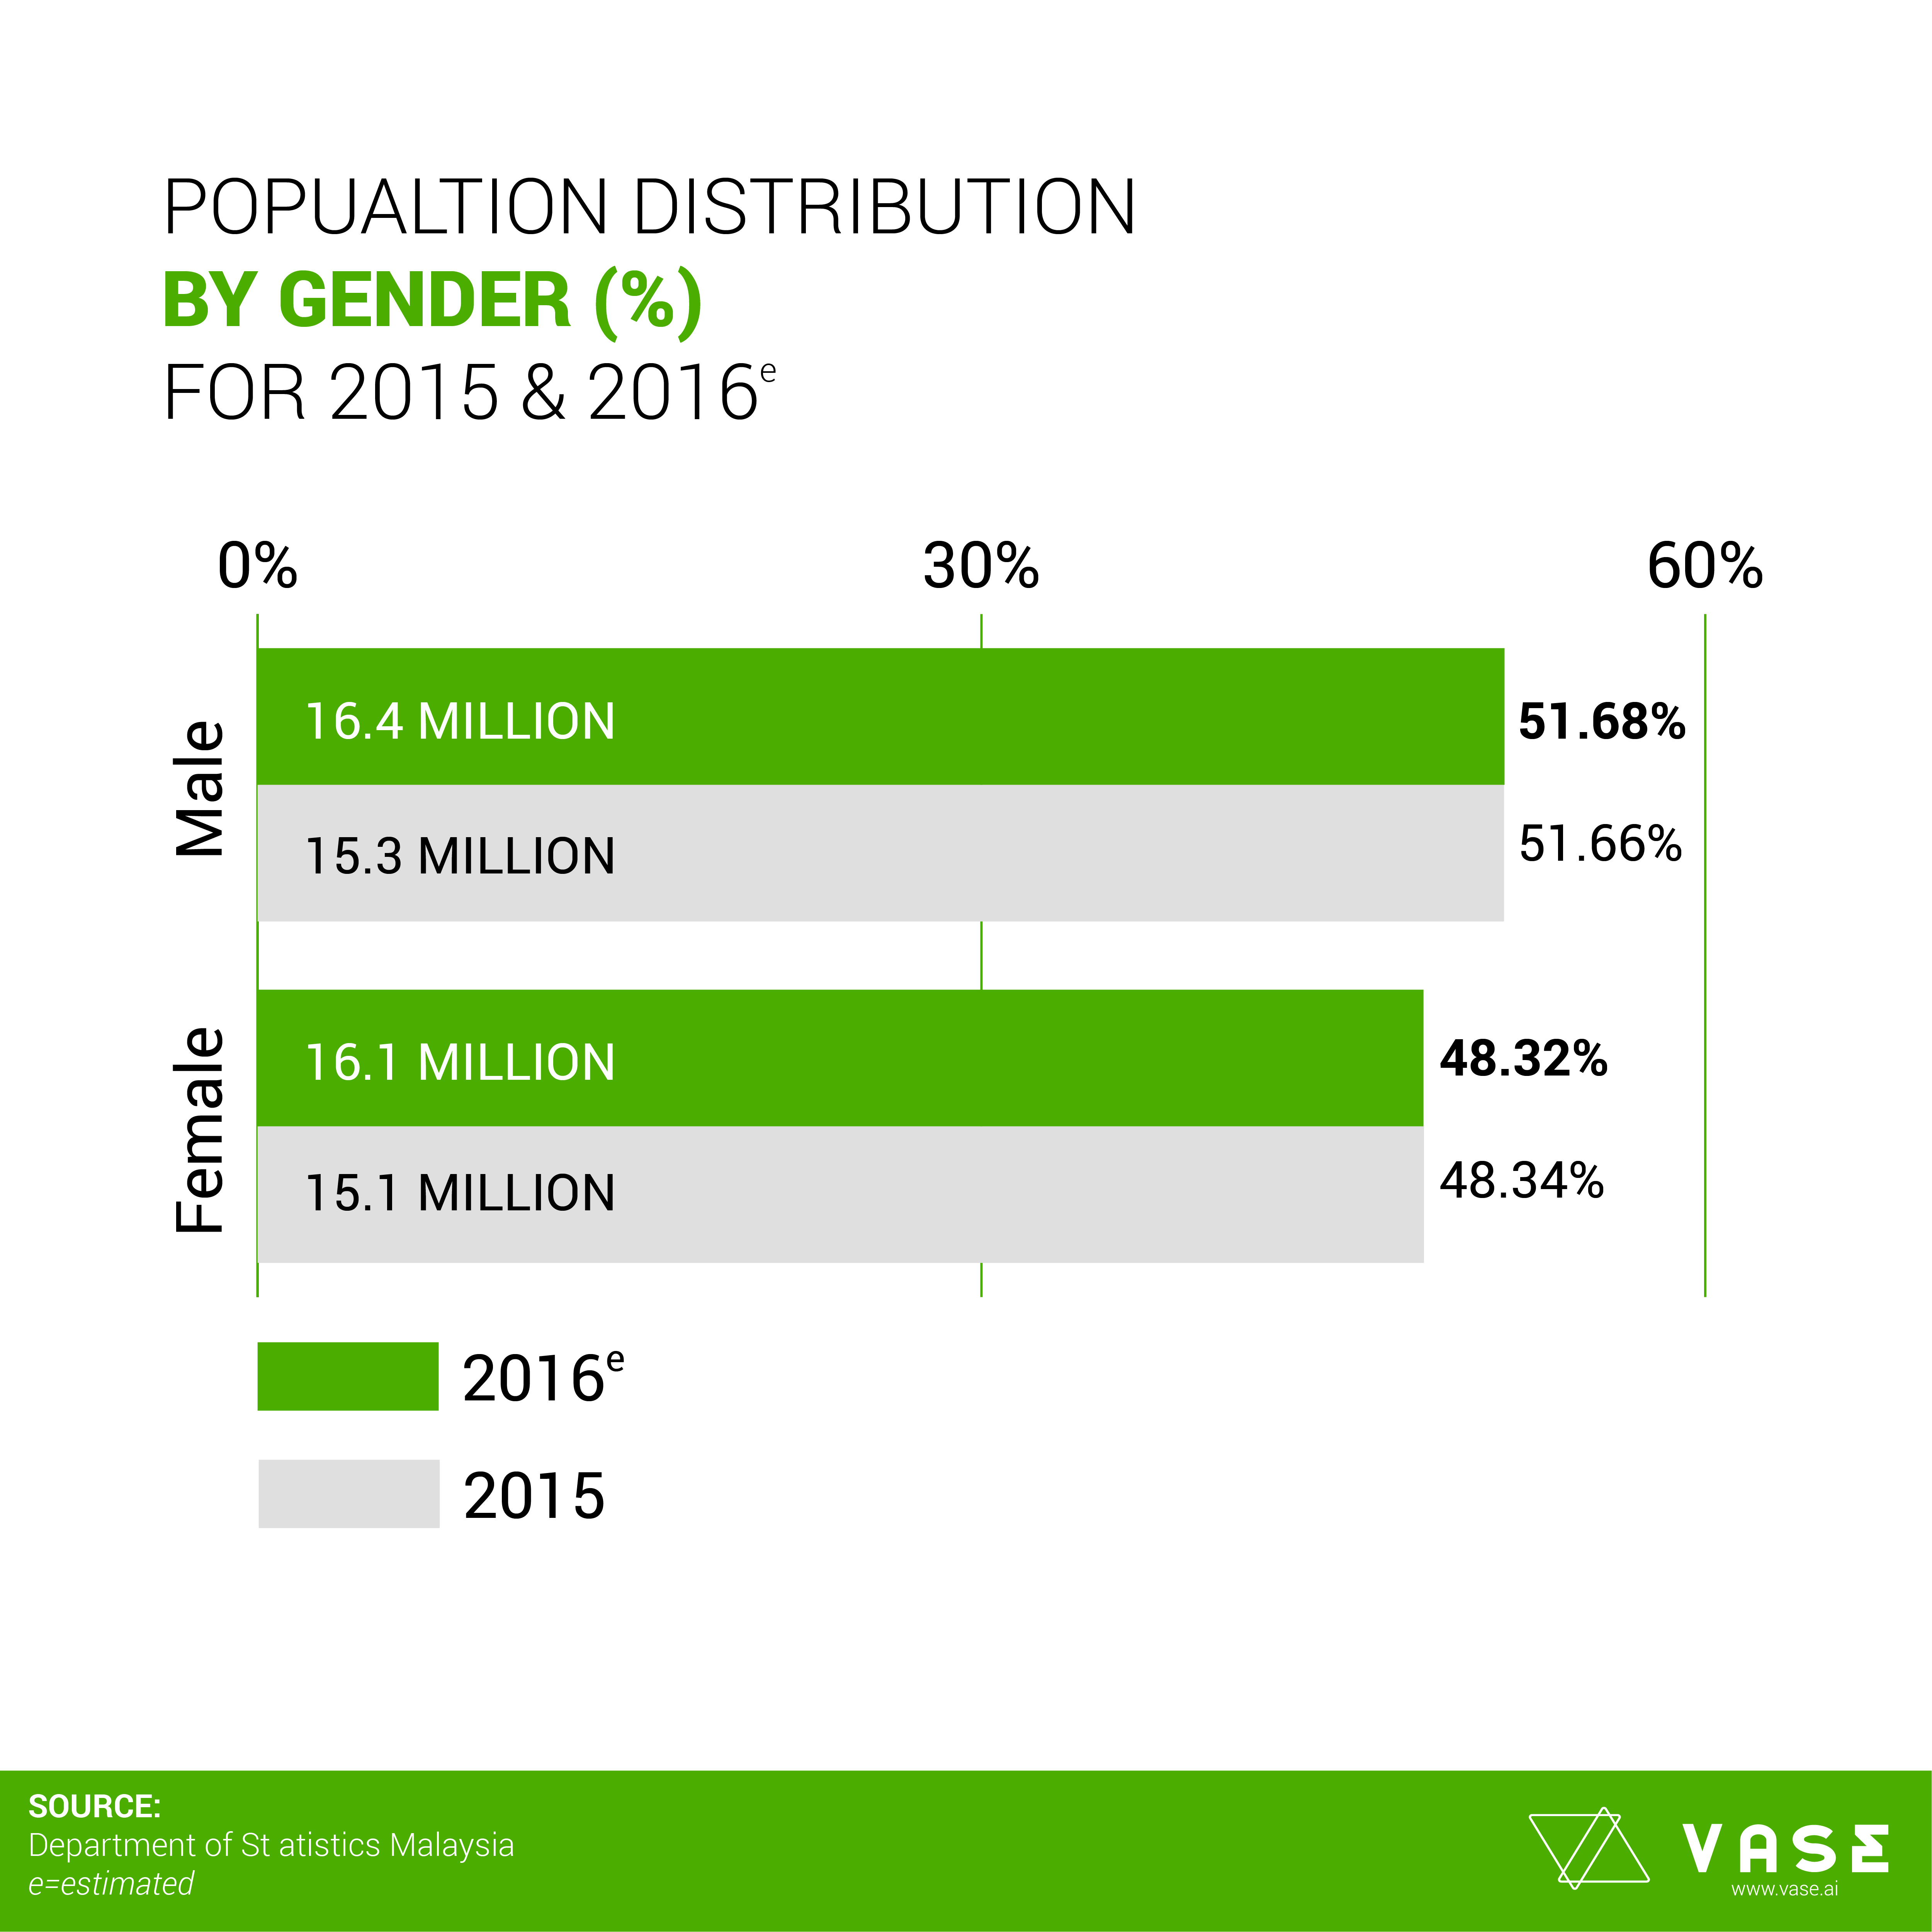
Malaysia’s total population in 2016 was 31.7 million persons (Male + Female Population Combined) compared to 3.12 million persons in 2015. Sex ratio for Malaysia in 2015 and 2016 was 107 respectively.
In terms of age structure of the population in 2016, population in group 0-14 years old decreased by 0.4 percentage points to 24.5 per cent. In contrast, the working age population (15-64 years) rose 0.3 percentage points and population aged 65 years and above increased 0.2 percentage points from 2015
For the 2016 state and strata estimates, the collected demographics shows that there is a trend of more people moving or more people living in urban areas rather than rural areas with states like Kuala Lumpur, Putrajaya, Selangor, Pulau Pinang and Melaka showing more than 90% people living in urban areas.The only state with more people in rural areas rather than urban areas is Kelantan with a 47.9% urban and 52.1% rural.